Up- then down-sampling to align timeseries data
The Problem:
We have a collection of time-series data. A given entity (here: subway station) is measured (here: for passenger volume) at some frequency. The exact timing of the sampling times is not consistent from entity to entity. For example, one station is sampled at midnight, 4am, 8am, noon, etc. Another is sampled at 2am, 6am, 10am, 2pm, etc. How can we compare time-vs-volume if samplling times are not aligned?
A Solution:
The astute blog-readers among you may have noticed an anomaly in my last blog post:
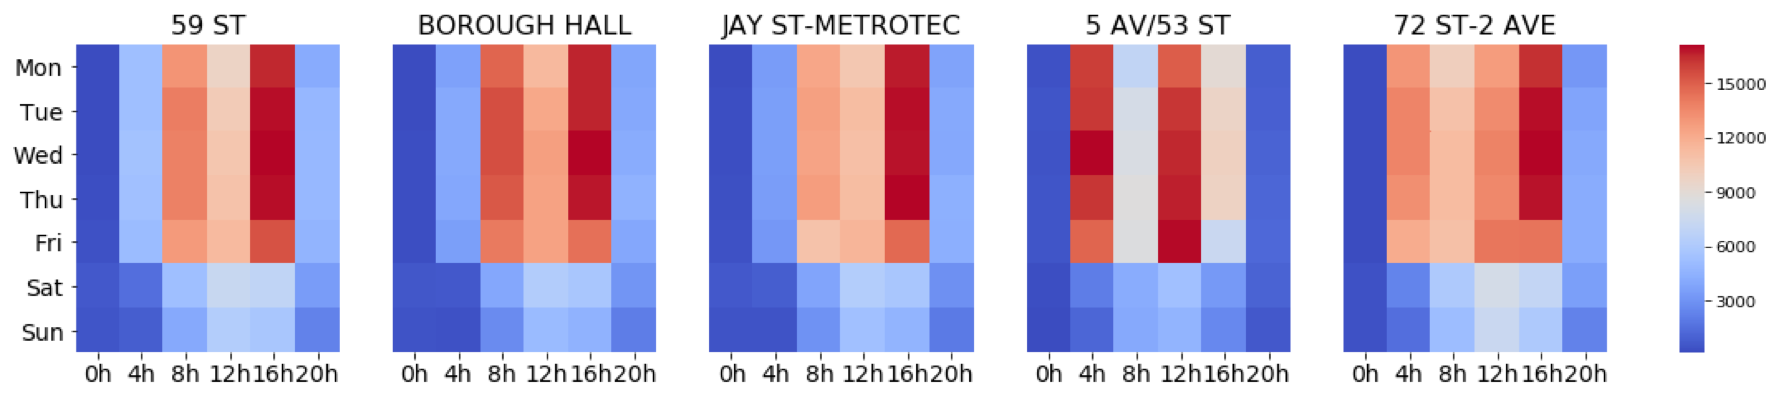
Notice that four of the stations have peak volume at the '16h' block, but 5 AV/53 ST's peak occurs during the 12h block. Upon digging deeper, I realized that was not real, but was an artifact of how we resampled the data.
Station volume data is reported every 4 hours. Most stations' data were reported at midnight (0h), 4am, 8am, noon (12h), etc:
df[df['STATION'] == 'BOROUGH HALL'].groupby('DATETIME').sum().head()
A few stations were reported at "odd" times, e.g. 2am, 6am, 10am, etc:
df[df['STATION'] == '59 ST'].head()
Originally, we simply performed a resample' of each station's volume data every 4 hours.
df2 = df.set_index('DATETIME')
df2 = df2.groupby(['STATION']).resample(rule='4H').sum().reset_index()
Note that the dataframe you are resampling must have a 'datetime' index, or you need to pass datetime values to the on keyword.
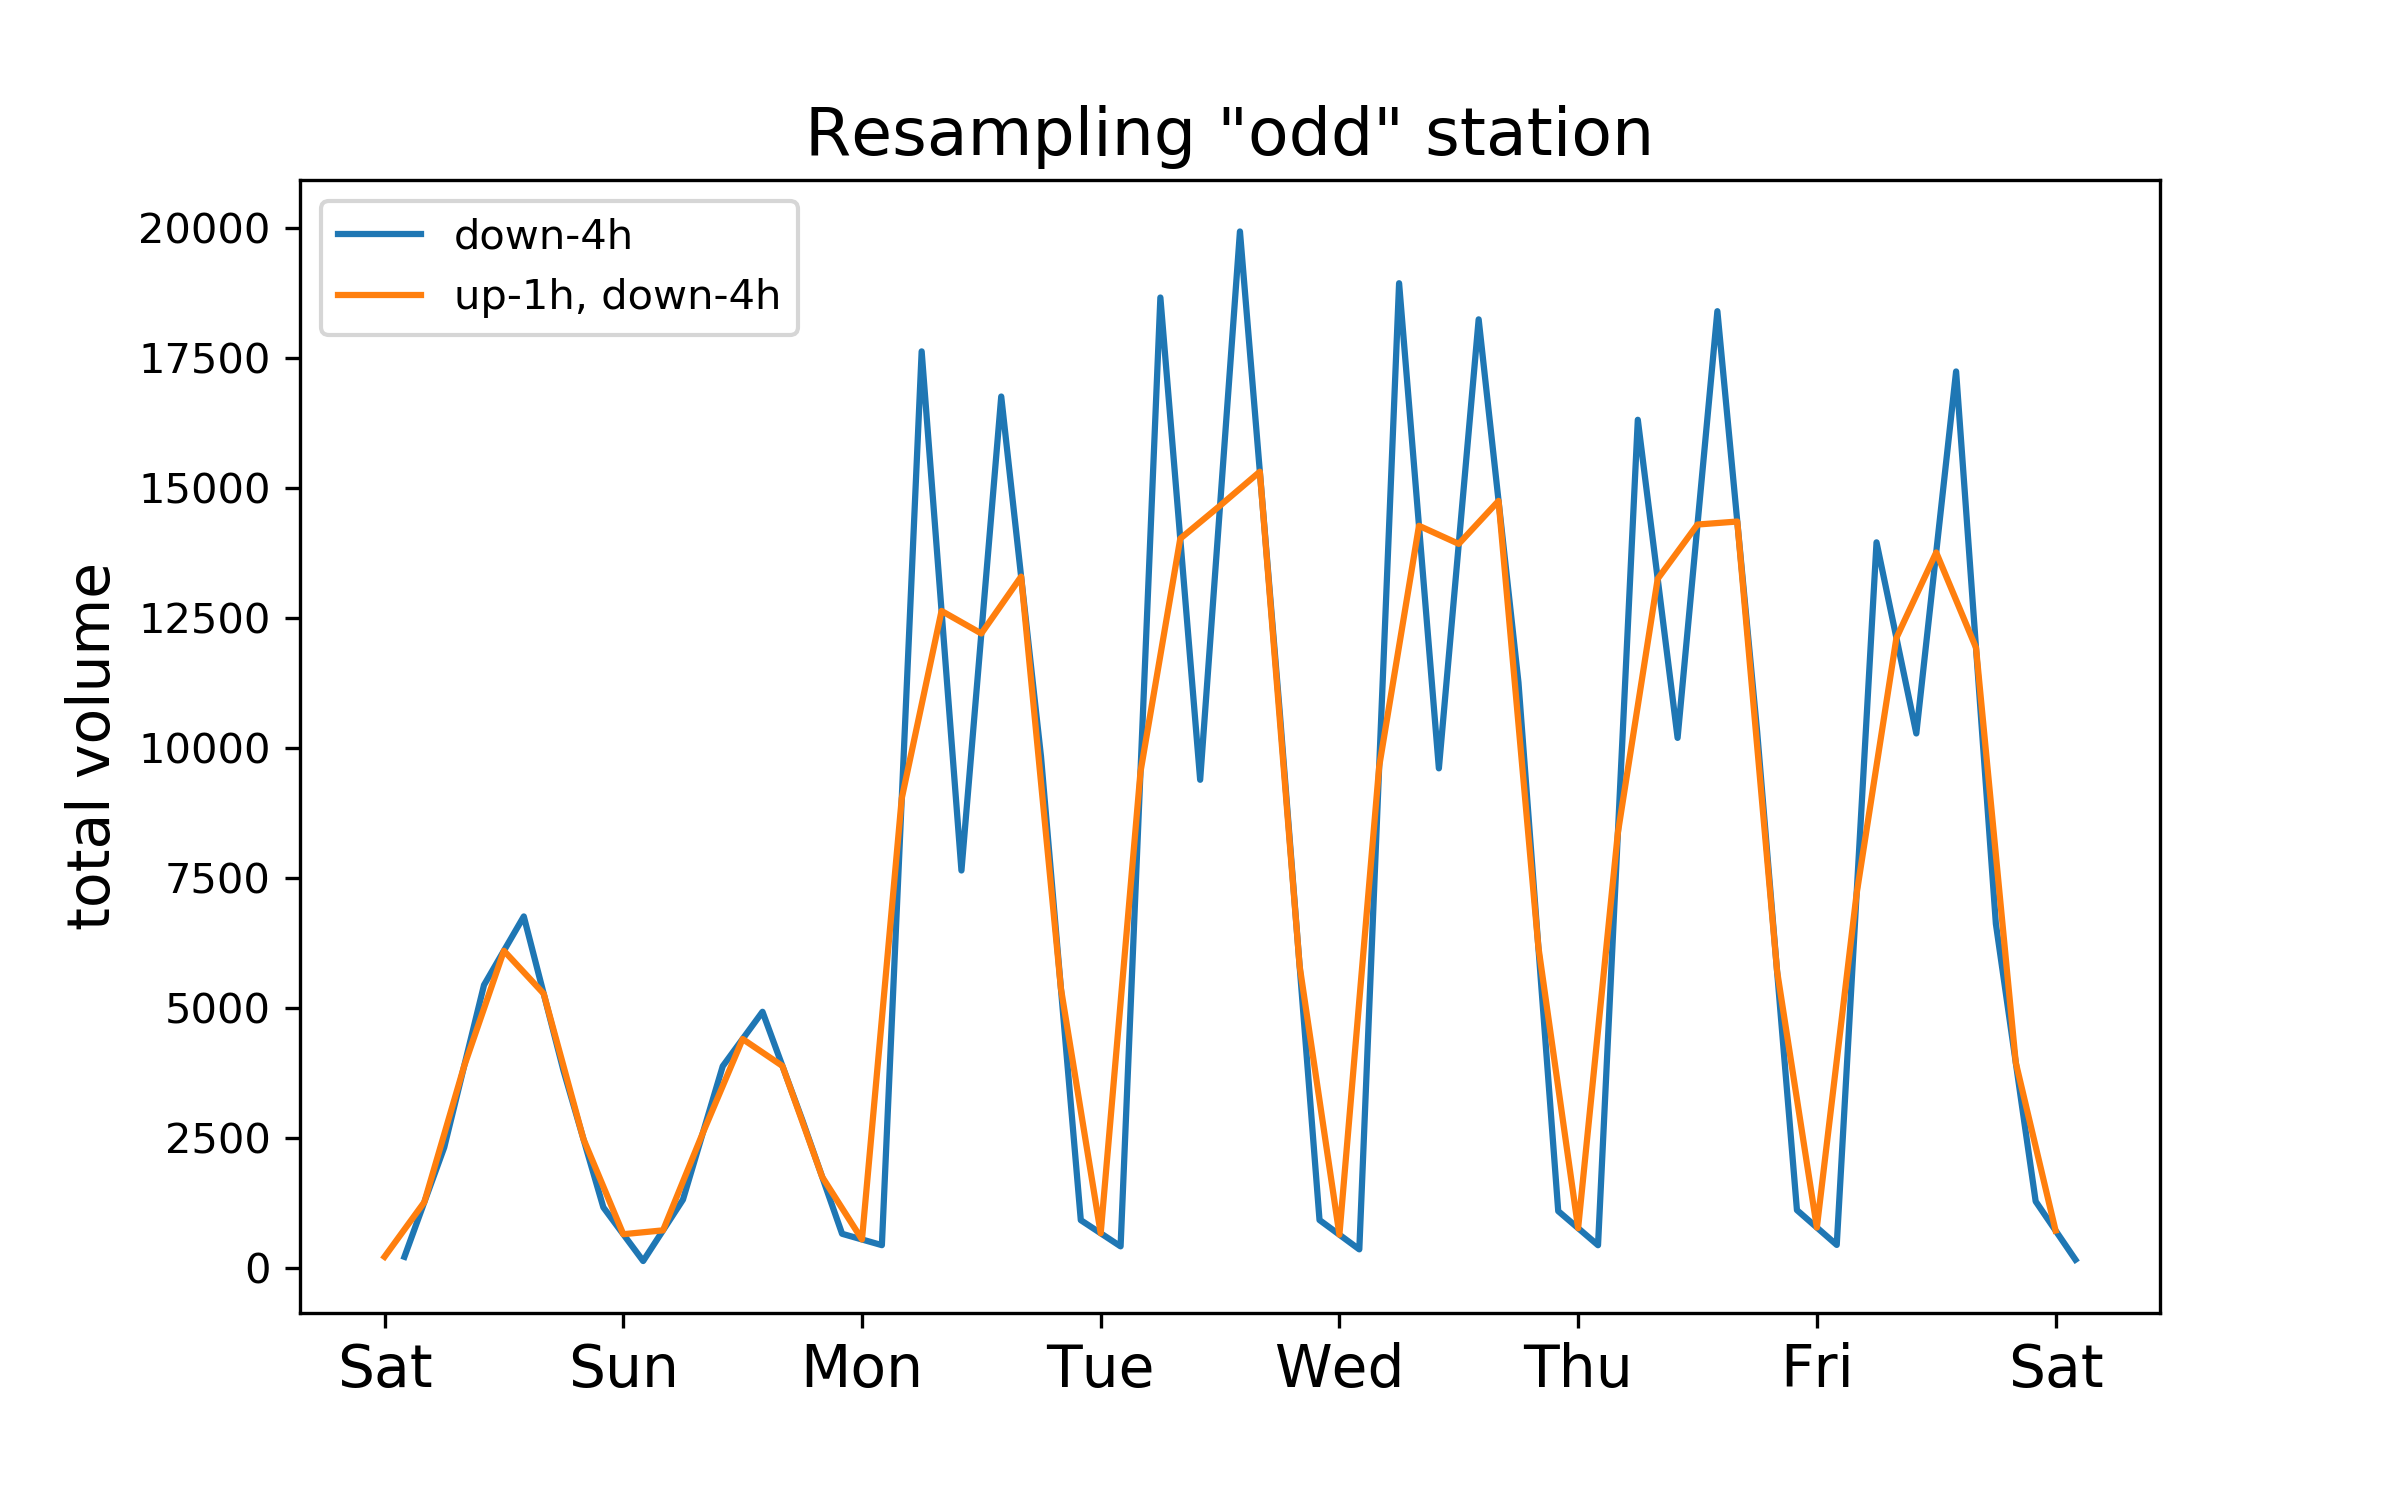
For the stations that were already sampled at at 0h, 4h, 8h, 12h, etc, this worked (or more accurately, it did nothing). For the stations which had odd sampling times, this resulted in odd and incorrected splitting of the volume (see the blue line in the plot below).
The solution is to "up" sample every 1h, then "down" sample to 4h. I created a "mini" dataframe for each station, grouped-by dateime (which then becomes the index), and then performed the up-then-down resampling.
def up_then_down(station):
    df1 = df[df['STATION'] == station]
    df2 = df1.groupby('DATETIME').sum()
    df3 = df2.resample(rule='1H').ffill()
    return df3.resample(rule='4H').mean()
This resulted in a "smoother" resampling:
Plotting this data as the heatmap shown at the beginning of this post, we see the "odd" station now looks as expected:

I would be remiss not to provide the links to the pandas documentation and user guide on resampling. One resamping does not an expert make!