Metis Project 3 ("McNulty"): Classification
Background
Breast cancer is the most common cancer in the U.S., period -- not just in women. 1 in 8 women will be diagnosed with the disease at some point in her life. While the 5-year survival rate is upwards of 84%, any improvement will translate to thousands of lives saved or improved.
I set out to predict the 5-year survival of breast cancer patients using data gathered by the National Cancer Institute's (NCI) Surveillance, Epidemeology, and End Results (SEER) program.
Data
I needed to request access to the data. Data was provided as a text file, in the format of a 362-character string for each entry:
925000100000001544102 020491958 00022008C50228500385003211 0126 0501002500001002000198798703098820110033331 0104000205500205505590 0 01 210 260001742C502 1161023 09980132202 134005 260002600040236991033011258 00761 2 20100033 99 8 0100
An accompanying 'SAS' file enabled decoding of this string. It provided the start position, length, abbreviation, and column name for the features contained within in a data entry. The first three features are shown below as an example:
data in;
  infile seer9 lrecl=362;
  input
    @ 1   PUBCSNUM             $char8.  /* Patient ID */
    @ 9   REG                  $char10. /* SEER registry */
    @ 19  MAR_STAT             $char1.  /* Marital status at diagnosis */
Using this information, I was able to transform the text file into a dataframe:
df3.iloc[:2, :10]
The initial dataset contained over 130 features and nearly 600,000 rows. I culled the features to only 12 based on the Code Book. Many of the features were redundant or did not apply to predicting survival. Taking the time to understand the features in my initial dataset saved me the trouble of feature selection later on. I furthermore reduced the complexity of some of the features I retained; for example, there were over 19 classes for race. After removing duplicates, dropping null entries, and encoding categorical features, my dataset had 17 columns and 220,000 rows.
My data was imbalanced, in that 84% of patients survive longer than 60 months (5 years), and only 16% do not.
Tools
- Python • Pandas • Numpy • SciPy
- scikit-learn • imbalance • skopt
- Matplotlib • Seaborn • Tableau
- Flask • HTML • CSS • Javascript
Modeling
I examined a variety of models including: Logistic Regression, Support Vector Classifier (SVC), Random Forest, Gradient Boosting, Ada Boosting, Naive Bayes.
To address the imbalanced nature of my dataset, I tried over- and under-sampling techniques, including: SMOTE, ADASYN (Over-sampling the minority class); Random Undersampling, Edited Nearest Neighbors, Near Miss (version 1 and 3), Neighborhood Cleaning Rule, One Sided Selection, Tomek Links (Under-sampling the majority class); SMOTE + EEN, SMOTE + Tomek (combination over- and under-sampling). I also explored an ensemble method: Balanced Bagging
I used stratified 5-fold cross-valdiation to assess models and over-/under-sampling methods. It was critical that I did the resampling with the cross-validation folds. When I did not, I observed overfitting for some of the models (Ada Boosting was particularly prone). Below is a function I used to automate this:
def assess_model_with_resamp(preprocessor, model, res, X, y, n=5):
    '''Resamples data 'X' and 'y' using 'res' method
    Tests estimator 'model' with preprocessing steps in 'preprocessor'
    All using Stratified 'n'-fold cross-validation
    Return ROC AUC score'''

    pipe =  Pipeline(steps=[('preprocessor', preprocessor), ('classifier', model)])
    cv = StratifiedKFold(n_splits=n, random_state=seed)
    scores = []
    for train, test in cv.split(X, y):
        X_res, y_res = res.fit_resample(X[train], y[train])
        pipe.fit(X_res, y_res)
        y_proba = model.predict_proba(X[test])[:,1]
        scores.append(roc_auc_score(y[test], y_proba))

    return np.mean(scores)
Results
Resampling did not improve model performance. Paramter tuning yielded only modest improvement over the default values for promising models. The best-performing model was Gradient Boosting, using a deviance loss function, maximum depth of 3, a learning rate of 0.24, and 200 estimators. The average AUC from cross-valdiation on the training set was 0.75; on the test (hold-out) set it was 0.71.
| Statistic | Value |
|---|---|
| Statistic | Value |
| Precision | 0.86 |
| Recall | 0.98 |
| F1-score | 0.92 |
| Specificity | 0.64 |
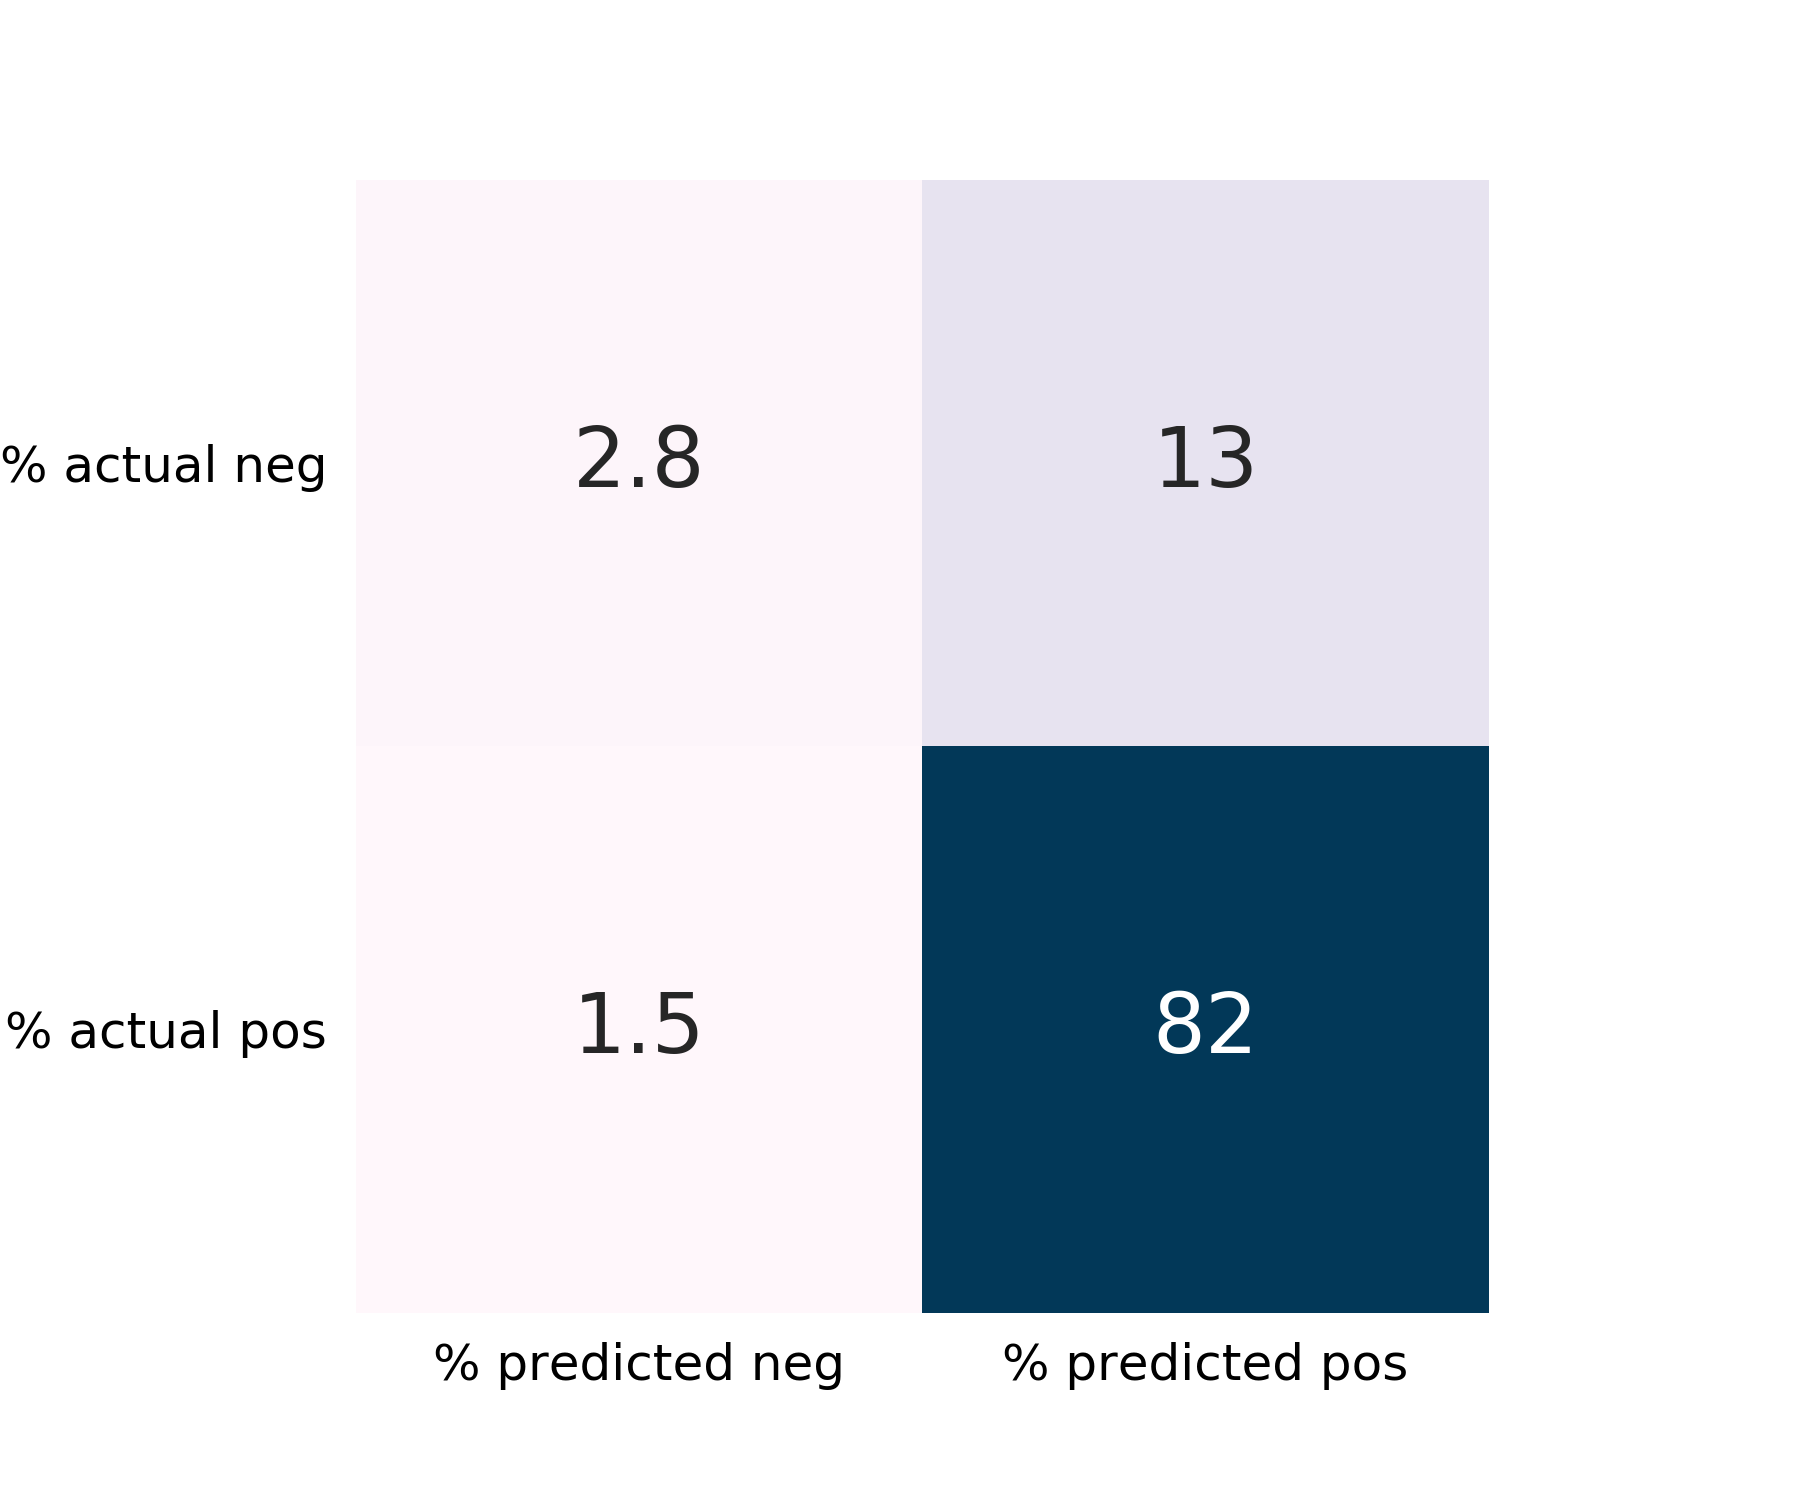
The false-negative rate is 1.5%, which is desirably low. The False-positive rate is somewhat high at 13%. Recall is excellent for the majority class, "Survived".
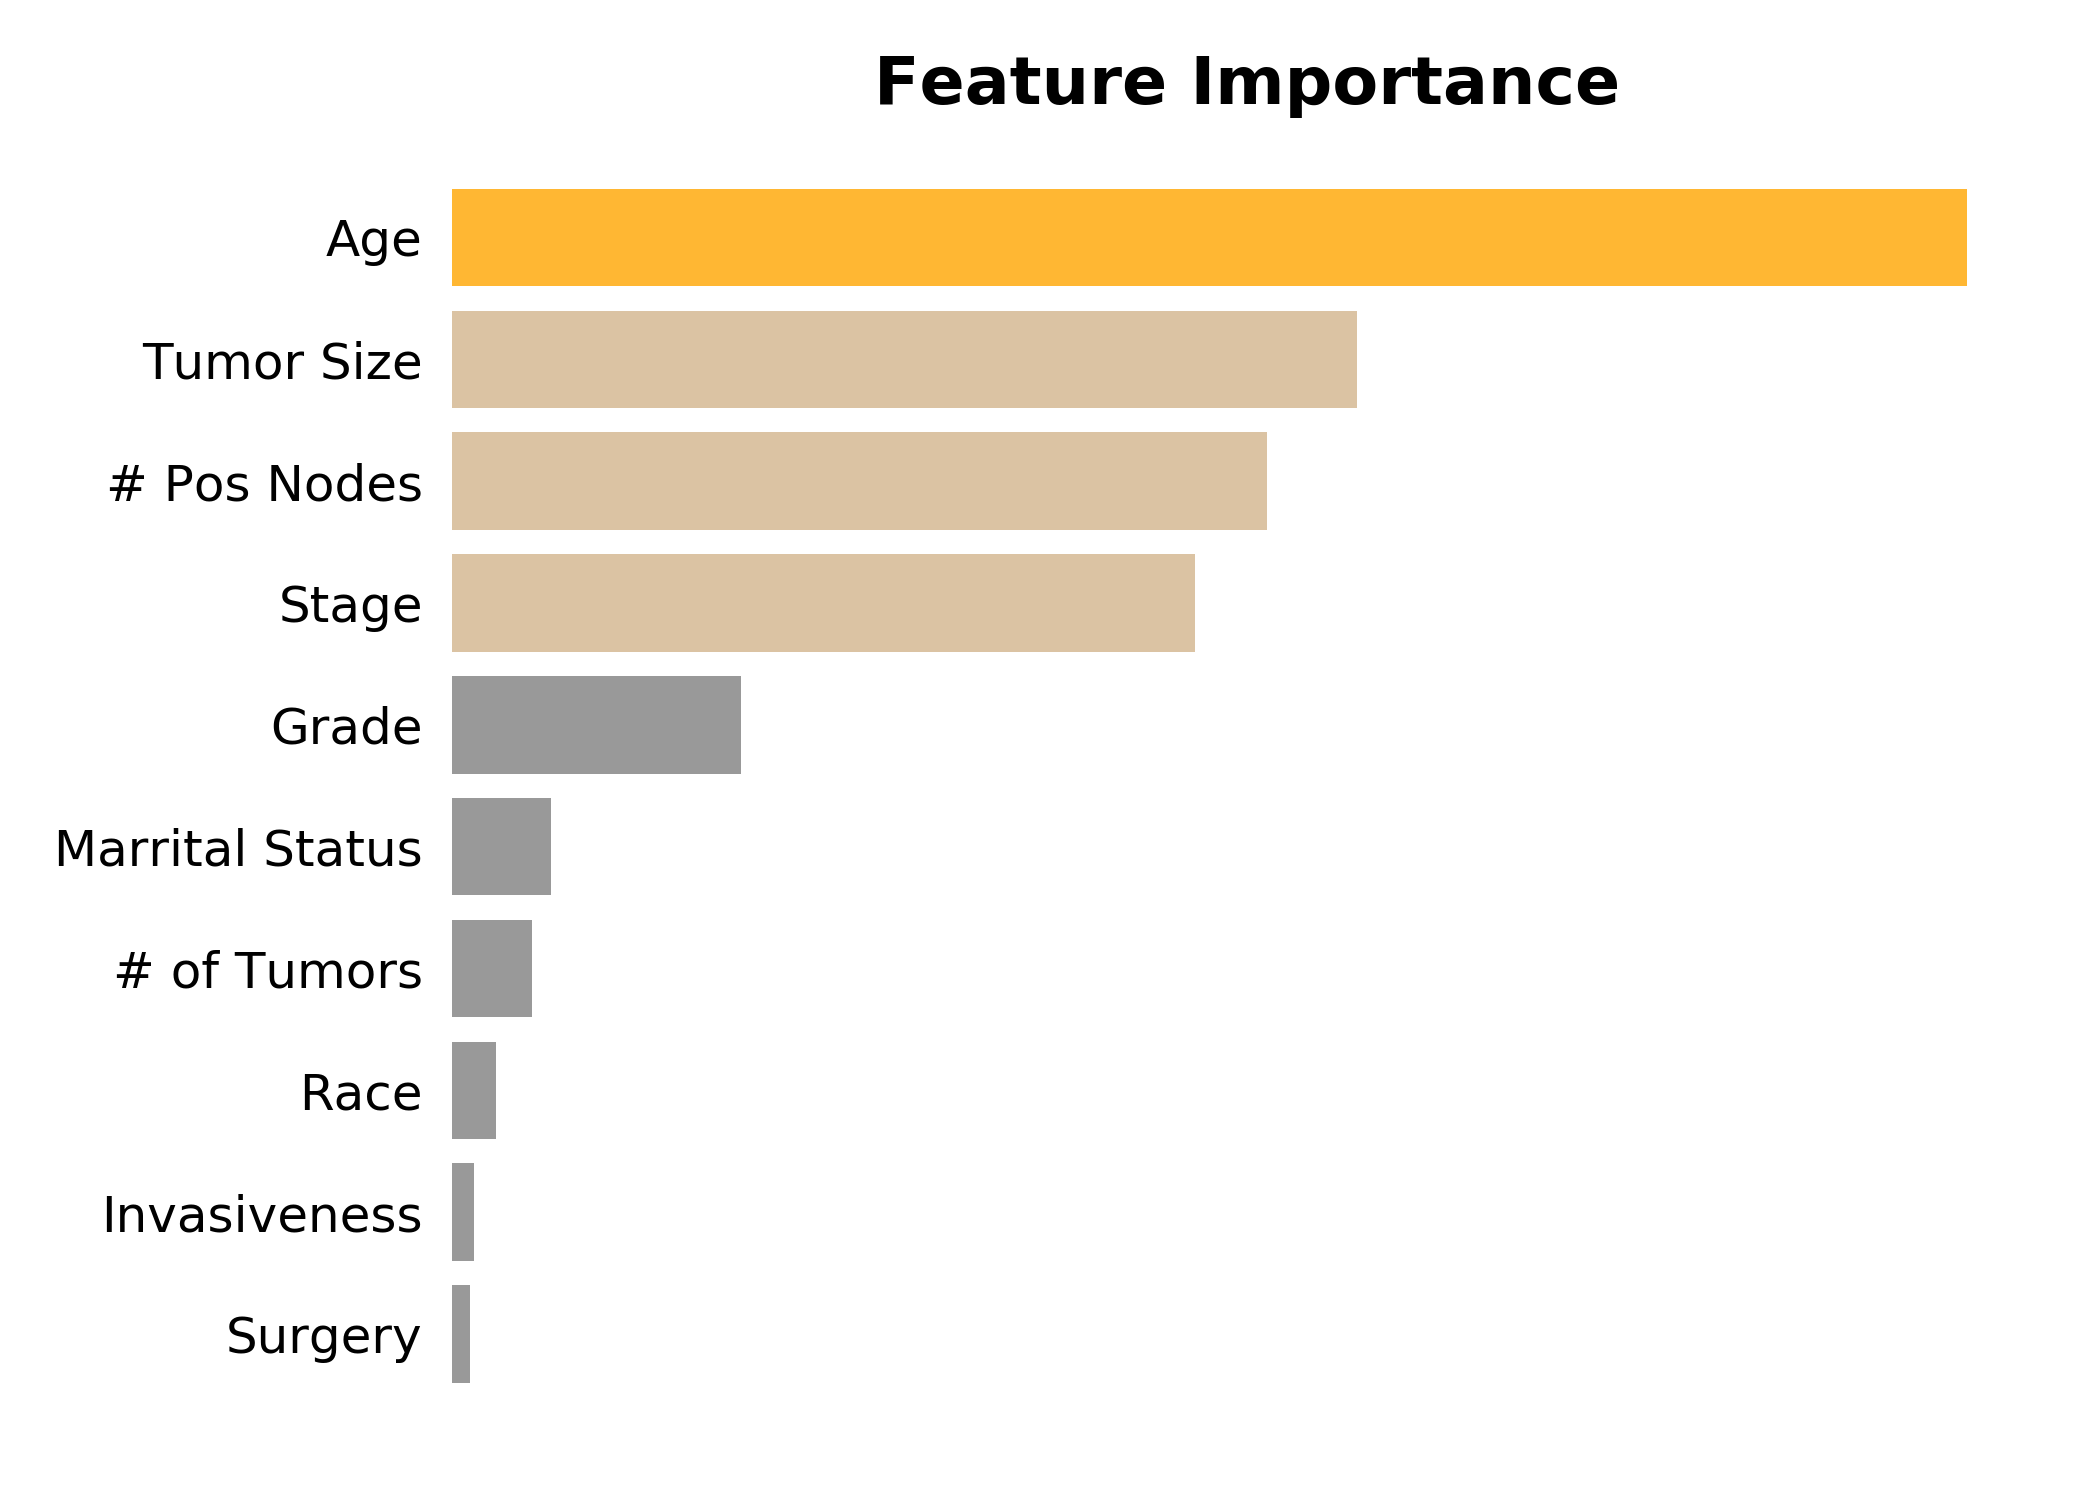
Inspecting the feature importances, we see, perhaps unsuprisingly, that age is the most important, followed by tumor size, the number of positive nodes, and stage.
Web App
I created a web app using flask to provide access to my model. Doctors and patients can enter in the tumor's characteristics at time of diagnosis and receive a prediction for 5-year survival. Patients with a poor prognosis could be flagged for more frequent follow-ups or more aggressive therapies.
Future Work
I had wanted to include molecular sub-type, Her2 +/- and HR +/-, in my model, but over 90% of the entries lacked this information. When a model was trained on a reduced-size dataset, including sub-type yielded only modest improvement over excluding it (0.67 vs 0.65 AUC, respectively). At this point in the learning curve (~20,000 entries), the training and test scores have not yet converged. It is thus plausible that acquiring more data for which sub-type and surivial are linked would yield an even better model.
Furthermore, I would like to include additional molecular data. Multigene prognostic tests, such as PAM50 and OncoType DX, are in wide use today and measure the expression of over 50 genes. Machine learning has the power to examine each gene individually and provide a more nuanced assessment of the multitude of breat cancer types.
Many of the features in my model are predictive of not just prognosis but also a cancer's response to a particular therapy. Tieing in treatment outcomes and side effects would assist in choosing an appropriate therapy. This is important not just for maximizing survival but also limiting side effects and improving a patient's quality of life.